RMI
Professional Cloud remote control and supervision system. RMI allows all the functionalities of managing your air conditioning systems to be done from wherever you are. You can also calculate the power consumption for each user, there also are advanced functionalities for monitoring energy consumption according to your requirements. The RMI package comes in several models to best suit your requirements.
Karakteristikat
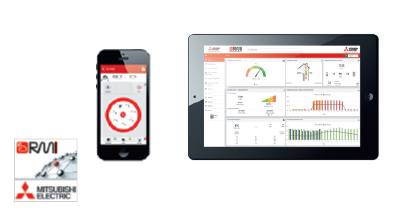
The Mitsubishi Electric RMI app, available for iOS and Android devices, lets users control their air conditioning systems, view and manage hot and cold-water production parameters and check for malfunctions.
Set weekly programmers’ and special events, and view and analyze the operating parameters of your system remotely from a mobile device with a graphic interface that lets you change settings instantaneously when needed.
The WEB Server (AE200, EW-50) centralized controller performs the crucial role of acquiring and monitoring data via the M-Net data transmission bus linking all the components of the VRF CITY MULTI, Mr. Slim or Residential system. A router (available as wired ADSL or 3G Mobile versions) creates a secure, protected communication channel with the RMI Server.
The modular flexibility of the RMI Server makes it possible to store enormous volumes of data, which is acquired, processed and archived for access from portable devices. This infrastructural complexity, combined with superior processing, management and security capabilities, is encapsulated in an extremely user-friendly concept, to help users optimize the energy usage of their systems.
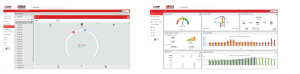
One of the great strengths of the RMI platform is its ability to create a wide variety of graphs for analyzing the performance and functions of the air conditioning installation. A tool available on the website and in the app lets users view and compare system operating parameters in choice of different graph formats. In addition to standard and simple to read statistical graphs, users can also generate custom line and bar graphs of parameters selected manually from those offered by the platform for comparison. The user can also define the time period represented in a graph and filter by type of unit.
This tool is helpful for any user who needs to keep the performance of the installation under close scrutiny in order to reduce energy consumption, and is particularly useful as a support tool for system administrators, designers, installers and maintenance technicians, which lets them offer the end user a system with even better efficiency and performance.